Last Mile Delivery Analytics for Indian Apparel Retailers 2026
Table of Contents
- Introduction
- The Problem Indian Retailers Face
- The Solution: What to Look For
- Key Metrics and Features
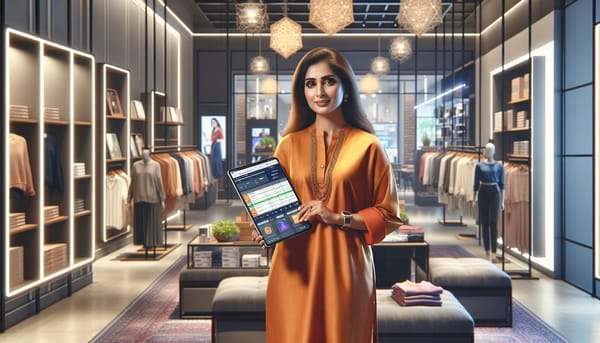
- How Commmerce Helps
- Conclusion
- FAQs
TL;DR
- Last mile delivery analytics help Indian apparel retailers reduce delivery costs by 25-40% through route optimization and partner performance tracking.
- Key metrics include delivery time, cost per shipment, first-attempt success rate, and customer satisfaction scores across different zones and logistics partners.
- Unified analytics platforms like Commmerce integrate data from multiple logistics providers to give retailers complete visibility into their delivery performance.
- Apparel retailers using delivery analytics see 15-30% improvement in customer satisfaction and 20% reduction in return-to-origin rates.
Introduction
Last mile delivery analytics for Indian apparel retailers has become critical for managing delivery costs and customer satisfaction in 2026. With online apparel sales growing rapidly and customer expectations for fast, reliable delivery increasing, retailers need comprehensive analytics to optimize their delivery operations.
The last mile delivery segment accounts for 40-50% of total logistics costs for apparel retailers, making it essential to track performance metrics, optimize routes, and choose the right delivery partners for each zone and customer segment.
The Problem Indian Retailers Face
Indian apparel retailers struggle with fragmented delivery data across multiple logistics partners and channels. Most retailers work with 3-5 different logistics providers like Delhivery, Shiprocket, and Ecom Express, but lack unified visibility into performance across partners.
Common challenges include:
- No consolidated view of delivery performance across different logistics partners
- High return-to-origin rates (15-25%) due to failed delivery attempts
- Inability to track true delivery costs including returns and re-attempts
- No zone-wise performance analytics to optimize partner selection
- Difficulty measuring customer satisfaction with delivery experience
- Manual reporting from multiple partner dashboards
- No integration between delivery data and customer purchase behavior
- Lack of real-time alerts for delivery exceptions and delays
₹40-80 per delivery is the average last mile cost for apparel in Indian metrosIndustry estimates for 2026
According to the India Brand Equity Foundation, the Indian retail market is expected to reach $2 trillion by 2032, with a significant portion being apparel sales requiring efficient last mile delivery.
The Solution: What to Look For
The ideal delivery analytics solution provides unified reporting across all logistics partners and sales channels. Look for platforms that integrate with major Indian logistics providers and offer real-time performance tracking.
Essential features include:
- Multi-logistics partner integration and unified dashboard
- Real-time shipment tracking and exception management
- Zone-wise and partner-wise performance analytics
- Cost optimization and route planning capabilities
- Customer satisfaction tracking and feedback integration
- Automated alerts for delivery delays and exceptions
- Returns analytics and reverse logistics tracking
- Integration with order management and inventory systems
Key Metrics and Features
Delivery Performance Metrics
Track key performance indicators that directly impact customer satisfaction and operational costs. Essential metrics include average delivery time, first-attempt delivery rate, and on-time delivery percentage.
- Average delivery time by zone and partner
- First-attempt delivery success rate
- On-time delivery percentage
- Exception rate and common failure reasons
- Customer rating and feedback scores
- Delivery slot adherence for scheduled deliveries
Cost Optimization Analytics
Monitor delivery costs across different partners, zones, and service levels to identify optimization opportunities. Include both direct costs and hidden costs like returns and re-delivery attempts.
| Cost Component | Metro Cities | Tier 2/3 Cities |
|---|---|---|
| Base delivery cost | ₹35-60 | ₹50-80 |
| Failed attempt cost | ₹15-25 | ₹20-35 |
| Return to origin | ₹40-70 | ₹60-100 |
| Premium delivery | ₹60-100 | ₹80-150 |
Customer Experience Tracking
Measure customer satisfaction with the delivery experience through ratings, reviews, and behavioral analytics. Track metrics like repeat purchase rates and customer complaints related to delivery.
- Customer delivery rating and feedback
- Delivery-related complaint resolution time
- Impact of delivery performance on repeat purchases
- Customer preference analysis for delivery slots and options
- NPS scores specifically for delivery experience
💡Pro TipTrack delivery performance during festival seasons separately, as logistics networks get strained and costs can increase by 30-50% during peak periods.
Zone-wise Performance Analysis
Analyze delivery performance across different geographical zones to optimize partner selection and service levels. Different logistics providers perform better in different regions of India.
- Metro vs non-metro performance comparison
- State-wise delivery success rates
- Pin code level performance analytics
- Urban vs rural delivery cost and time differences
- Partner performance ranking by zone
How Commmerce Helps
Commmerce's omnichannel retail platform includes comprehensive delivery analytics that unify data from all your logistics partners in one dashboard. Unlike traditional billing software like Vyapar or Marg ERP, Commmerce provides end-to-end visibility from order creation to final delivery.
Key delivery analytics features include:
Unified Logistics Integration
Native integrations with Delhivery, Shiprocket, Ecom Express, and other major Indian logistics providers. All delivery data flows into one unified dashboard for complete visibility.
Real-time Performance Tracking
Track delivery performance across all partners and channels in real-time. Get instant alerts for delayed shipments, failed attempts, and delivery exceptions.
Automated Route Optimization
The platform's intelligent routing logic automatically selects the best logistics partner for each shipment based on destination zone, cost, and historical performance data.
Cost Analytics and Reporting
Comprehensive cost tracking including base delivery charges, failed attempt costs, returns, and premium service charges. Generate partner-wise cost comparison reports.
Customer Feedback Integration
Collect and analyze customer delivery feedback through WhatsApp-based surveys and SMS. Correlate delivery performance with customer satisfaction scores and repeat purchase behavior.
For more insights on optimizing your delivery operations, check out our Last-Mile Delivery and Fulfilment Guide for Indian Retailers and Hub and Spoke Delivery Model for Indian Fashion Chains: Complete Setup.
⚠️Watch OutMany retailers track only successful deliveries and miss the hidden costs of failed attempts, returns, and customer acquisition impact of poor delivery experience.
The platform also integrates delivery analytics with your broader retail operations. See how delivery performance impacts sales through our Multi-Store Sales Analytics Dashboard for Indian Fashion Chains 2026 guide.
Learn more about optimizing delivery costs with our Multi-Store Delivery Route Optimization for Grocery Chains: Cut Costs 40% methodology that applies to apparel retailers as well.
Running a retail business in India?See how Commmerce unifies your stores, inventory, orders and delivery in one platform.Schedule a Free Demo
Conclusion
Last mile delivery analytics for Indian apparel retailers in 2026 is essential for controlling costs, improving customer satisfaction, and scaling operations efficiently. With delivery costs representing nearly half of total logistics expenses, retailers need comprehensive analytics to optimize partner selection, route planning, and customer experience.
The key is having unified visibility across all logistics partners and sales channels, combined with actionable insights that help reduce failed attempts, optimize costs, and improve customer satisfaction. Retailers using advanced delivery analytics typically see 25-40% reduction in delivery costs and significant improvements in customer retention.
For more information on implementing delivery analytics and related retail operations improvements, explore our guides on Real-Time Delivery Tracking for Indian Fashion Retailers: Complete Guide and Automated Order Fulfillment for Multi-Store Chains: OMS Integration Guide.
FAQs
Q: What are the key metrics to track in last mile delivery for apparel retailers?
A: Key metrics include delivery time, cost per delivery, first-attempt delivery rate, customer satisfaction scores, return to origin rates, and zone-wise performance analytics.
Q: How can delivery analytics reduce costs for apparel retailers?
A: Analytics help optimize delivery routes, identify peak delivery windows, reduce failed attempts, consolidate orders, and choose the most cost-effective logistics partners for each zone.
Q: What is the average last mile delivery cost for apparel in India?
A: Last mile delivery costs for apparel typically range from ₹40-80 per shipment in metros and ₹60-120 in tier 2/3 cities, depending on weight, distance and service level.
Q: How does Commmerce help with delivery analytics for apparel retailers?
A: Commmerce provides unified delivery analytics across all channels, logistics partner integrations, automated routing logic, and real-time performance tracking from one dashboard.
Q: What are the biggest challenges in apparel delivery analytics in India?
A: Major challenges include fragmented data across logistics partners, lack of real-time visibility, difficulty in measuring true customer satisfaction, and integrating returns data with forward logistics metrics.
Disclaimer: This article is for general informational purposes only and does not constitute legal, financial, or tax advice. GST rules, compliance requirements, and platform features may change over time. Please verify the latest guidelines with a qualified professional or refer to official sources such as the GSTN or CBIC. Market statistics mentioned are based on publicly available estimates and may not reflect current figures. Commmerce product features referenced are accurate at the time of writing and subject to change.