Last Mile Delivery KPIs for Indian Retailers: Track Performance 2026
Table of Contents
- Introduction
- The Problem Indian Retailers Face
- The Solution: What to Look For
- Key Delivery KPIs to Track
- How Commmerce Helps
- Conclusion
- FAQs
TL;DR
- Last mile delivery KPIs for Indian retailers include on-time delivery rate, cost per order, customer satisfaction score, and return-to-origin rate.
- Tracking delivery performance across multiple channels requires unified data from all delivery partners and sales touchpoints.
- Retailers achieving 85%+ on-time delivery rates and under ₹50 cost per order typically see higher customer retention and profitability.
- An omnichannel retail platform can consolidate delivery metrics from all channels into actionable insights for better decision-making.
Introduction
Last mile delivery KPIs for Indian retailers have become the cornerstone of customer satisfaction and business profitability in 2026. With Indian e-commerce growing rapidly and customer expectations reaching new heights, retailers must track precise delivery metrics to stay competitive and profitable.
The last mile delivery landscape in India presents unique challenges, from traffic congestion in metro cities to address accuracy issues in tier-2 and tier-3 locations. For multi-store retailers managing both online and offline channels, tracking delivery performance becomes even more complex when orders flow through different fulfillment centers, delivery partners, and customer touchpoints.
According to industry estimates, last mile delivery accounts for nearly 40-50% of total logistics costs for Indian retailers. Yet many retailers still lack visibility into critical delivery metrics that directly impact customer experience and bottom-line profitability. The right KPIs can help retailers identify bottlenecks, optimize costs, and improve customer satisfaction across all channels.
The Problem Indian Retailers Face
Indian retailers struggle with fragmented delivery data across multiple channels and partners. Most retailers using traditional systems like Vyapar, Marg ERP, or TallyPrime lack integrated delivery tracking capabilities, forcing them to manually compile data from different logistics providers.
The core challenges include:
Disconnected Delivery Data: Orders from physical stores, online channels, and marketplaces use different delivery partners, creating data silos. Retailers cannot get a unified view of delivery performance across all channels.
Manual Tracking Processes: Without automated systems, store managers spend hours collecting delivery data from emails, WhatsApp messages, and partner portals. This manual approach leads to delayed insights and missed optimization opportunities.
No Real-Time Visibility: Traditional retail systems provide delivery updates only after completion, making it impossible to proactively address delays or issues that impact customer experience.
Cost Control Blind Spots: Retailers struggle to track actual delivery costs per order, per channel, and per delivery partner. This lack of granular cost data prevents effective negotiation with logistics providers and identification of profitable delivery zones.
Customer Communication Gaps: Without integrated tracking, retailers cannot provide accurate delivery updates to customers, leading to increased support calls and lower satisfaction scores.
⚠️Watch OutMany retailers focus only on delivery time but ignore cost per order and customer satisfaction metrics, leading to unsustainable delivery operations that hurt profitability.
The Solution: What to Look For
Effective last mile delivery tracking requires a comprehensive approach that unifies data from all delivery channels and partners. Retailers need systems that can capture, analyze, and present delivery metrics in real-time dashboards that drive actionable insights.
The ideal solution should provide automated data collection from all major Indian logistics partners including Delhivery, Shiprocket, Ecom Express, and local delivery teams. Integration capabilities ensure that delivery data flows seamlessly from order creation to customer delivery confirmation.
Real-time tracking capabilities allow retailers to monitor delivery performance as it happens, enabling proactive intervention when delays occur. This includes automated alerts for delayed shipments, failed delivery attempts, and customer complaints related to delivery experience.
Advanced analytics features help retailers identify patterns and trends in delivery performance across different channels, locations, and time periods. These insights enable data-driven decisions about delivery partner selection, zone-wise optimization, and customer communication strategies.
Integration with customer communication tools ensures that accurate delivery updates reach customers through their preferred channels, whether WhatsApp, SMS, or email. This proactive communication reduces support queries and improves overall customer experience.
Key Delivery KPIs to Track
Successful last mile delivery management requires tracking specific metrics that directly impact customer satisfaction and business profitability. Here are the essential KPIs every Indian retailer should monitor:
On-Time Delivery Rate
On-time delivery rate measures the percentage of orders delivered within the promised timeframe. This KPI directly impacts customer satisfaction and repeat purchase behavior. Calculate this by dividing successful on-time deliveries by total delivery attempts within a specific period.
For Indian retailers, a good on-time delivery rate ranges from 85-95% depending on the category and delivery zones. Fashion and electronics retailers typically achieve higher rates in metro cities, while furniture and appliance retailers may see lower rates due to scheduling complexity.
Track this KPI by channel (online store, marketplace, walk-in orders) and by delivery partner to identify performance variations. Use this data to optimize delivery partner selection and set realistic customer expectations based on location and product category.
Average Delivery Cost Per Order
Delivery cost per order reveals the true economics of your fulfillment operations. Calculate this by dividing total last mile delivery expenses by the number of orders delivered. Include all costs: delivery partner fees, packaging, insurance, and any additional charges.
This metric varies significantly across India based on delivery zones, order value, and product dimensions. Metro cities typically see costs between ₹30-80 per order, while tier-2 and tier-3 cities may range from ₹50-150 per order depending on logistics infrastructure.
Monitor cost per order trends to negotiate better rates with delivery partners and identify opportunities for bulk shipping discounts. Compare costs across different delivery partners for the same routes to optimize partner selection based on cost-effectiveness.
Delivery Time from Dispatch
Average delivery time measures how long orders take to reach customers after dispatch from your fulfillment location. This KPI helps set accurate customer expectations and identify delivery bottlenecks in specific geographic areas.
Track delivery time by city, state, and delivery partner to understand performance variations. Use this data to optimize inventory placement across multiple stores and warehouses, ensuring faster delivery times for high-demand products in specific regions.
Consider seasonal variations and local factors like monsoons, festivals, and traffic patterns that impact delivery times in different Indian markets. This granular analysis helps improve delivery promises and customer communication.
Customer Satisfaction Score for Delivery
Customer satisfaction specifically related to delivery experience provides direct feedback on your last mile performance. Collect this data through post-delivery surveys, app ratings, and customer feedback forms.
Track satisfaction scores for different aspects: delivery time accuracy, packaging quality, delivery person behavior, and communication effectiveness. This detailed feedback helps identify specific areas for improvement in your delivery operations.
Compare satisfaction scores across different delivery partners and channels to identify best practices and areas needing attention. Use this feedback to train delivery teams and improve overall customer experience.
💡Pro TipTrack delivery satisfaction separately from product satisfaction to get accurate insights into your logistics performance versus product quality issues.
Return-to-Origin Rate
Return-to-origin (RTO) rate measures the percentage of orders that come back to the seller due to failed delivery attempts, customer unavailability, or order rejection. High RTO rates significantly impact profitability and customer experience.
Calculate RTO rate by dividing returned orders by total dispatch orders. Indian retailers typically see RTO rates between 8-25% depending on product category, customer segment, and delivery locations.
Analyze RTO reasons to identify patterns: incorrect addresses, customer unavailability, product quality concerns, or pricing issues. This analysis helps implement preventive measures like address verification, customer confirmation calls, and better product descriptions.
First Attempt Delivery Success Rate
First attempt delivery success measures how often orders get delivered on the first delivery attempt. Higher success rates reduce delivery costs and improve customer satisfaction by minimizing delivery delays.
Track this metric across different time slots, delivery partners, and customer segments. Use insights to optimize delivery scheduling, improve customer communication about delivery windows, and train delivery teams on effective customer interaction.
Consider factors like customer availability patterns, delivery time preferences, and local customs that impact first attempt success rates in different Indian markets.
| KPI | Good Performance | Tracking Frequency |
|---|---|---|
| On-Time Delivery Rate | 85-95% | Daily |
| Cost Per Order | ₹30-80 (Metro) | Weekly |
| Customer Satisfaction | 4.2+ out of 5 | Weekly |
| RTO Rate | Below 15% | Daily |
| First Attempt Success | 70-85% | Daily |
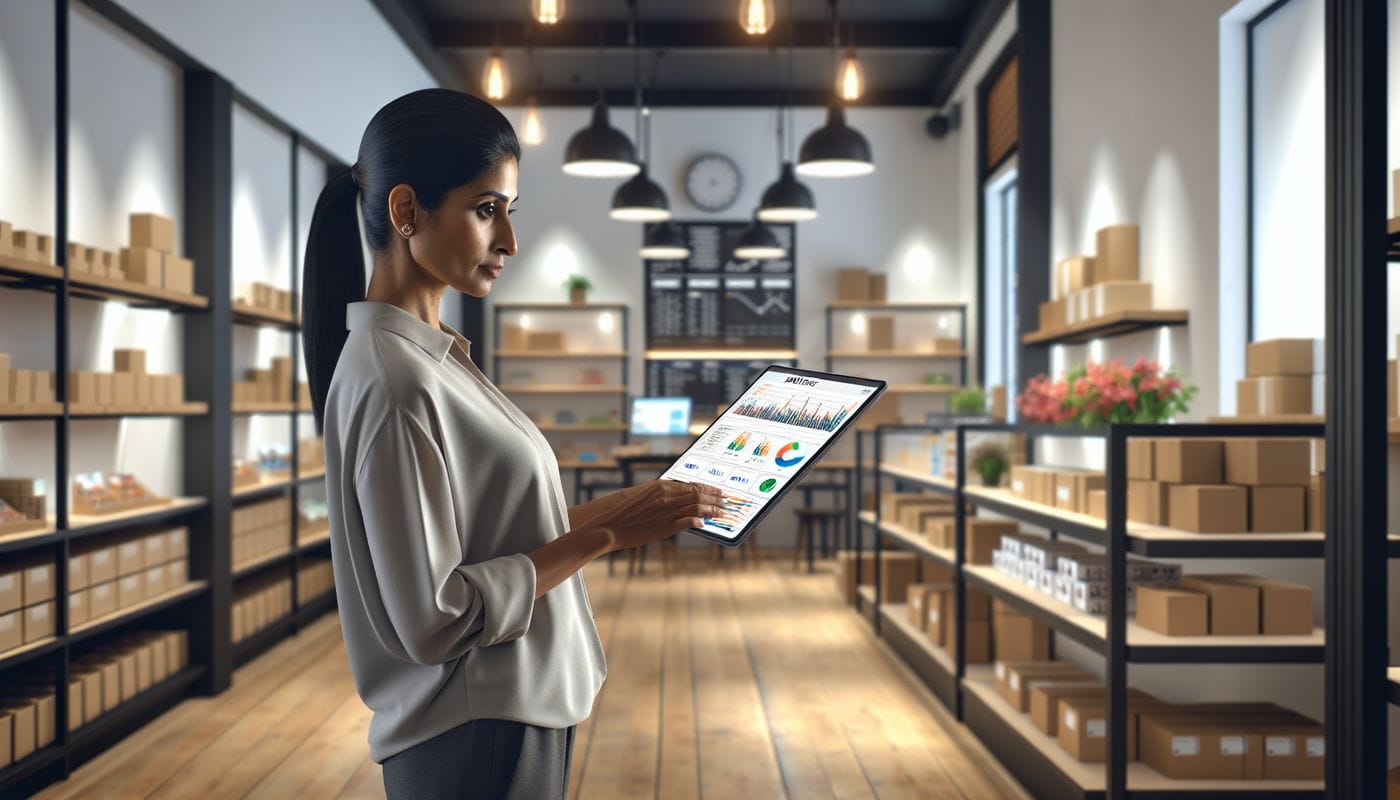
How Commmerce Helps
Commmerce, an Omnichannel Retail Operating System built for Indian retailers, provides comprehensive delivery tracking and analytics capabilities that unify last mile performance data across all channels and partners.
The platform's integrated logistics management connects seamlessly with major Indian delivery partners including Delhivery, Shiprocket, and Ecom Express. This native integration automatically captures delivery data from all partners, eliminating manual data collection and providing real-time visibility into delivery performance across your entire retail operation.
Unified Delivery Dashboard: Track all key delivery KPIs from a single dashboard that consolidates data from online stores, physical store deliveries, and marketplace orders. Monitor on-time delivery rates, cost per order, and customer satisfaction scores across all channels simultaneously.
Real-Time Performance Alerts: Receive automated notifications when delivery performance drops below set thresholds. Get instant alerts for delayed shipments, high RTO rates in specific zones, or customer complaints related to delivery experience.
Cost Analytics and Optimization: Analyze delivery costs across different partners, routes, and order values. Identify opportunities for cost reduction through better partner selection, zone optimization, and bulk shipping strategies. The system calculates true cost per order including all associated fees and charges.
Customer Communication Integration: Automatically send delivery updates to customers via WhatsApp, SMS, and email based on real-time tracking data from delivery partners. Reduce support queries and improve customer satisfaction through proactive communication.
Multi-Channel Order Routing: Optimize delivery performance by automatically routing orders to the most appropriate fulfillment location based on inventory availability, customer location, and delivery partner performance. This intelligent routing improves delivery times and reduces costs.
Advanced Reporting and Analytics: Generate detailed reports on delivery performance trends, seasonal patterns, and partner comparisons. Use these insights to negotiate better rates with logistics providers and optimize delivery operations for different market segments.
Unlike traditional retail systems like Vyapar or Marg ERP that lack integrated delivery tracking, Commmerce provides end-to-end visibility from order creation to customer delivery. This comprehensive approach helps retailers achieve better delivery performance while maintaining cost control across all sales channels.
Running a retail business in India?See how Commmerce unifies your stores, inventory, orders and delivery in one platform.Schedule a Free Demo
The platform's delivery management capabilities integrate seamlessly with other retail operations including inventory management, order processing, and customer relationship management. This integration ensures that delivery performance data connects with broader business metrics for comprehensive retail analytics.
For retailers managing multiple store locations, Commmerce provides location-wise delivery performance tracking. Compare delivery metrics across different stores and regions to identify best practices and areas needing improvement. This granular analysis helps optimize inventory placement and delivery strategies for different market segments.
Conclusion
Tracking last mile delivery KPIs for Indian retailers in 2026 requires a systematic approach that unifies data from all delivery channels and partners. The key metrics, on-time delivery rate, cost per order, customer satisfaction, RTO rate, and first attempt success, provide comprehensive insights into delivery performance and profitability.
Retailers who invest in proper delivery tracking and analytics systems see significant improvements in customer satisfaction and operational efficiency. The ability to monitor performance in real-time, identify bottlenecks quickly, and optimize delivery operations based on data-driven insights becomes a competitive advantage in India's dynamic retail market.
Success in last mile delivery requires more than just tracking metrics. It demands integrated systems that connect delivery performance with broader retail operations, enabling retailers to make informed decisions about inventory placement, customer communication, and delivery partner selection.
For multi-store retailers looking to optimize their delivery operations across all channels, investing in an omnichannel retail platform that provides unified delivery tracking and analytics capabilities is essential for long-term success and profitability in the Indian market.
FAQs
Q: What are the most important last mile delivery KPIs for Indian retailers?
A: The most critical KPIs include on-time delivery rate, average delivery cost per order, delivery time from dispatch, customer satisfaction score, and return-to-origin rate.
Q: How do you calculate delivery cost per order in India?
A: Delivery cost per order is calculated by dividing total last mile delivery expenses by the number of orders delivered in a specific period.
Q: What is a good on-time delivery rate for Indian retailers?
A: A good on-time delivery rate for Indian retailers is 85% or higher, with top-performing retailers achieving 90-95% consistency.
Q: How can retailers track delivery performance across multiple channels?
A: Retailers can track delivery performance across channels using an omnichannel retail platform that consolidates data from all delivery partners and sales channels into unified dashboards.
Q: What delivery KPIs help reduce customer complaints in India?
A: Key KPIs to reduce complaints include delivery accuracy rate, damage rate during transit, successful first-attempt delivery rate, and average customer response time for delivery issues.
Disclaimer: This article is for general informational purposes only and does not constitute legal, financial, or tax advice. GST rules, compliance requirements, and platform features may change over time. Please verify the latest guidelines with a qualified professional or refer to official sources such as the GSTN or CBIC. Market statistics mentioned are based on publicly available estimates and may not reflect current figures. Commmerce product features referenced are accurate at the time of writing and subject to change.